

Why Economic Policy Analysis Needs a Regional Lens
Without regional analysis, even well-funded policies can miss their goals


Public discourse about economic inequality usually focuses on individuals or households.1 Common metrics, such as the income shares of the top 1% or 10%, offer telling indicators of the wide and growing dispersion in families’ incomes. In many contexts, the household-level focus is appropriate, especially for policies that redistribute income (such as the One Big Beautiful Bill Act) or provide social insurance (such as Medicaid) based on individual or household eligibility.
But measures of inequality at the individual or household level provide limited guidance about where national policies take hold or why economic growth fails to reach people in specific places. A regional perspective can help clarify the geographic incidence of policy and identify the local conditions that shape whether growth translates into jobs and rising household incomes. Recent research also underscores that regional inequality itself has become more important for explaining the overall dispersion in incomes, making place an increasingly important lens for understanding inequality.
Federal efforts toward reindustrialization and supply-chain configuration have also sharpened the need for regional economic analysis. These policies are being deployed into a landscape of regional divergence, where the capacity to absorb new investment, training, and infrastructure spending varies widely across places. Without understanding that landscape, even well-funded industrial policies may concentrate gains in already-thriving regions while bypassing distressed ones. Yet, on the whole, national policymakers still tend to rely more heavily on either microdata on individuals and households or highly aggregated macroeconomic indicators, and pay less attention to the regional dynamics that shape local economic performance. Building stronger analytical capability at policy institutions would improve policymakers’ ability to understand where growth occurs, why it fails to reach households in some places, and how emerging shocks, such as those from climate risk to AI adoption, may add to uneven regional opportunities and impacts.
Place-Based Divergence: County-Level Trajectories Are Pulling Apart
In the decades following World War II, many poorer regions of the U.S. tended to grow faster than richer ones. Indeed, many Southern states narrowed the per capita income gap with Northern states during this period. For residents, this regional convergence showed up in everyday life in the form of higher earnings, more and better job options, and improved local amenities. But since about the late 1970s, income dispersion across households and across places have been rising steadily, reversing the post-World War II trend of convergence.
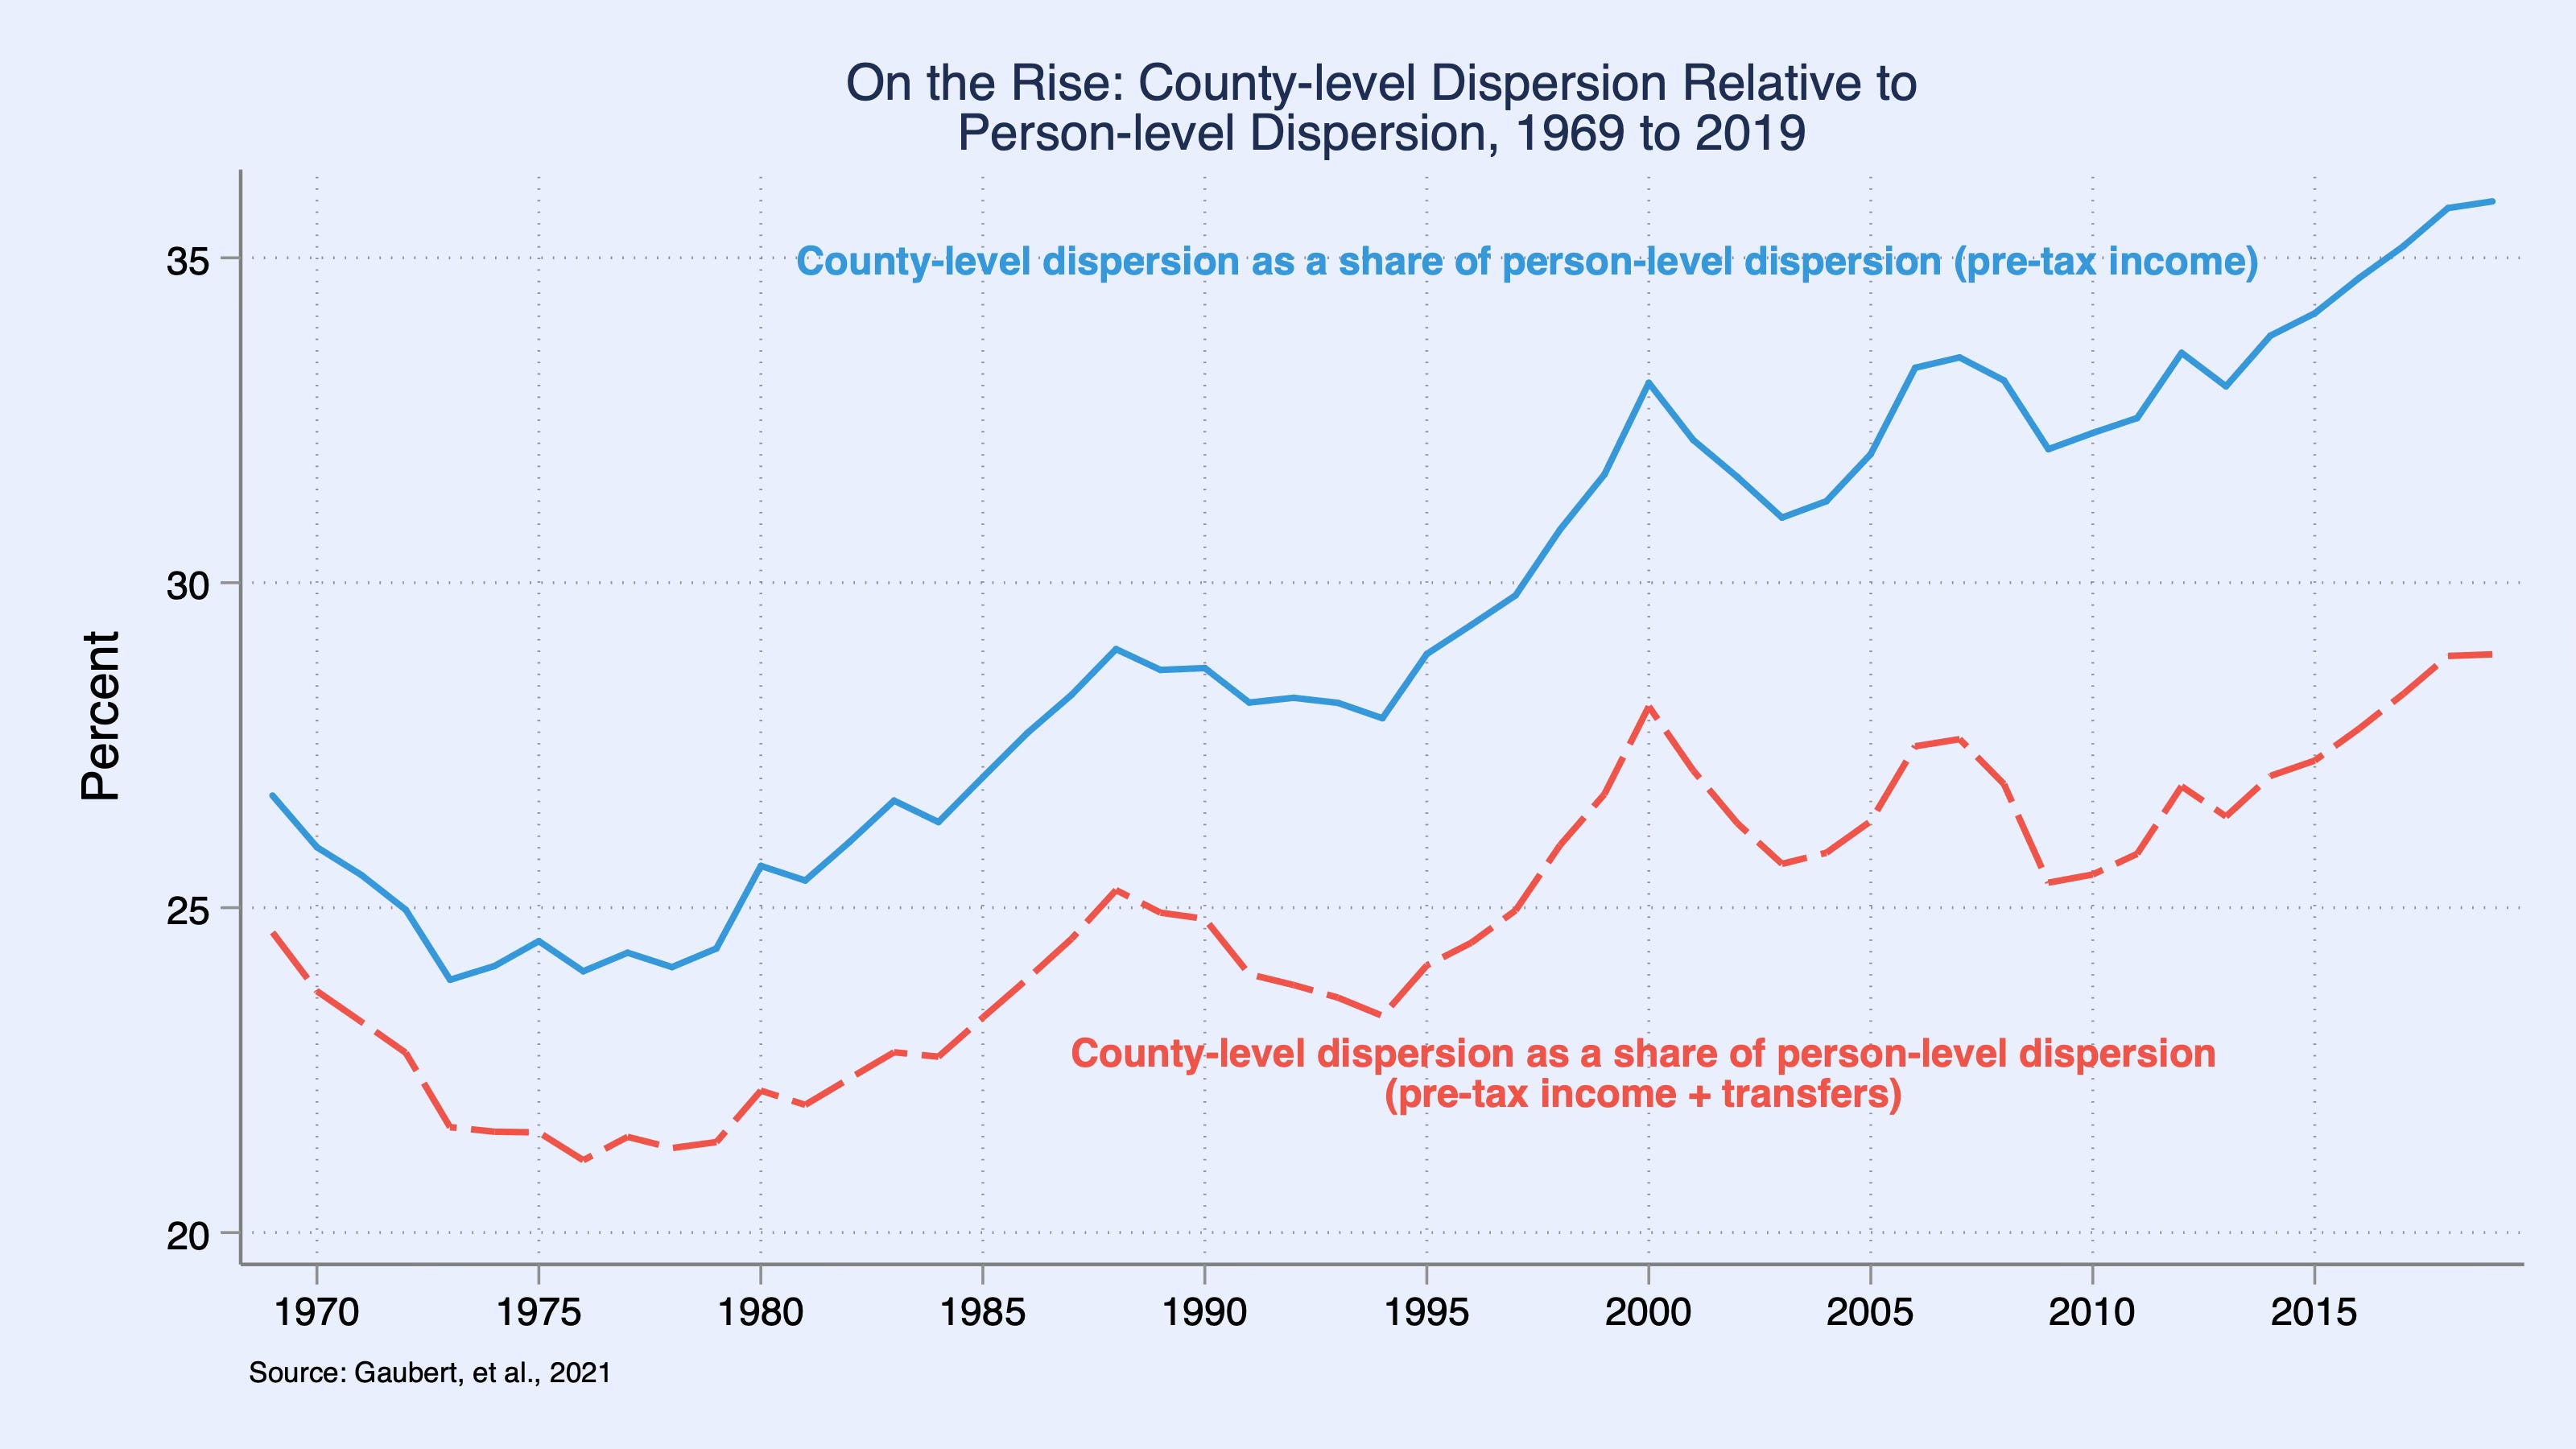
By 1980, regional convergence weakened and largely disappeared by the late 1990s. Since then, higher-income places have tended to grow faster than lower-income ones. Figure 1 also shows that county-level dispersion in income accounts for a growing share of person-level income dispersion since the late 1960s. By 2019, this share hit an all-time high for the pre-tax measure of income and was near a series high for a measure that also considers federal transfers.
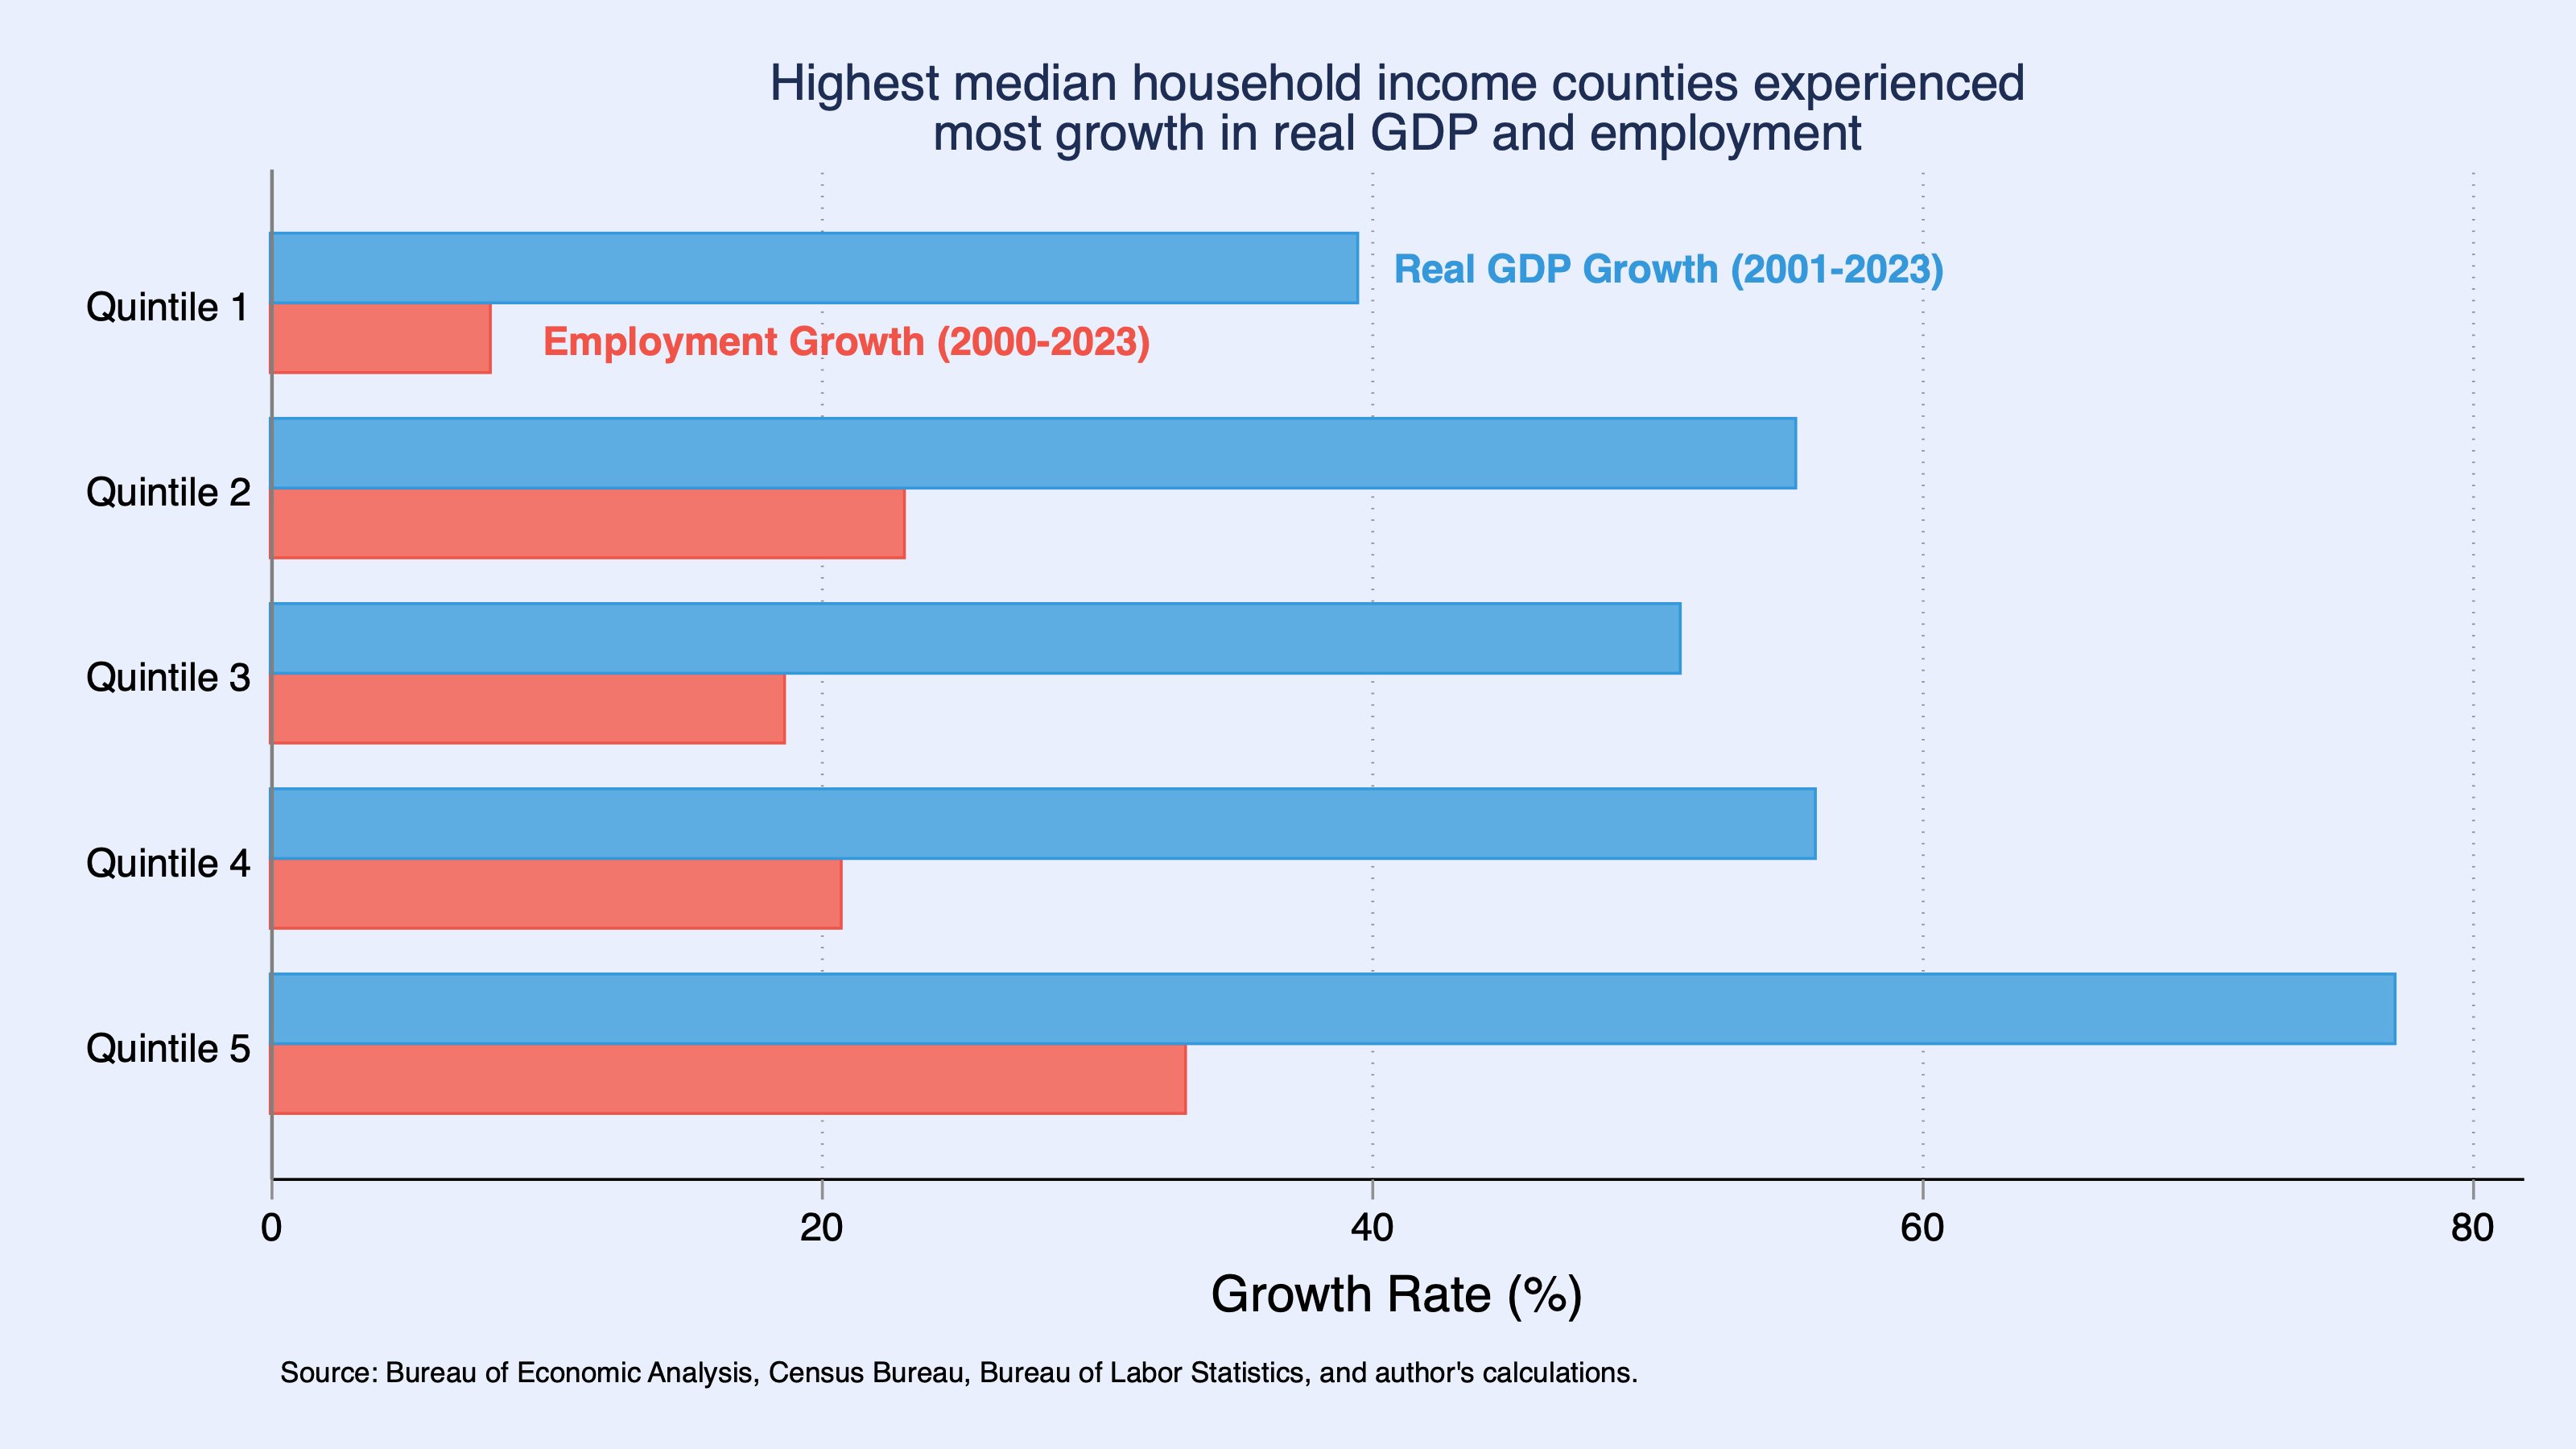
That rising (relative) importance of place is also visible in counties’ growth trajectories. Counties that ranked highest in median household income in 2000 went on to post the strongest gains in both GDP and jobs for the next two decades (Figure 2), while counties at the bottom posted the weakest performance. Between 2001 and 2023, counties whose median household income put them in the bottom fifth experienced a 39.5% increase in real GDP and an 8% increase in employment. For counties in the top fifth of the county median household income distribution, GDP grew 77.2% and employment grew 33.2%.
Within counties, GDP growth doesn’t always translate into jobs or higher income for all households
Differences across counties are only part of the story. Even when counties experienced economic growth, that growth was not broadly shared within them. Between 2001 and 2023, real GDP growth was widespread, and nearly everyone lived in a county where the local economy grew (albeit at very different rates). Yet only about three-quarters of Americans live in a county where employment expanded. County GDP growth, in other words, does not always translate into local labor market gains.
This feature of economic growth among counties is not a statistical anomaly. Rather, several dynamics can drive a wedge between output growth and employment growth. Output can rise because firms invest in capital, adopt labor-saving technologies, or realize productivity gains that do not require comparable increases in hiring. Growth led by a small number of highly productive firms, for example, may boost local GDP without generating additional jobs. More broadly, “jobless recoveries” have marked several U.S. recessions since 2000, especially in middle-skill occupations vulnerable to automation and restructuring, such as bookkeeping, assembly line operations, and data entry. These dynamics tend to play out unevenly across places because productive firms, automation pressures, and spillover effects from weak labor demand are themselves geographically concentrated. Understanding why growth translates unevenly into jobs and income, and designing policies responsive to them, require looking beyond national statistics and more closely at local economic conditions.
The lack of employment growth is not the only way that economic growth can fail to translate to broad-based improvements in living standards. Economic growth is an imperfect proxy for gains in household income. From 2000 to 2023, inflation-adjusted median household income did grow faster in places where the economy expanded more. But the scale of those gains was much smaller, with median household income rising by 8.7%, compared with 59.3% growth in real GDP and 19.3% growth in employment.
As with job growth, several broader forces also held back growth in median household income during much of the 2000-2023 period. Slower productivity growth, weaker business dynamism, subdued wage growth, and the effects of the Great Recession all contributed to weak gains in median household income, even as GDP continued to rise. Regional dynamics compounded these broad forces. Trade shocks were concentrated in particular manufacturing regions, innovation gains accrued disproportionately to a small number of high-skill metros, and housing constraints varied with local regulation and market conditions. In some places, these forces held back growth in median household income directly while in others, they widened the gap between output growth and what reached workers paychecks. Tracing those patterns regionally is therefore essential for both understanding the geography of inequality and identifying the combinations of forces that have held back household income growth.
Why Regional Analysis Must Be Central to Policymaking
These patterns are not just academic. Rather, they shape how policies should be designed and evaluated. Because national aggregates average across divergent local trajectories, they can obscure both the sources of underperformance and the most promising policy levers. If convergence has faded and economic growth does not lead to more jobs or income, then analyzing regional conditions becomes essential to understanding how national policies interact with local economies.
Research shows that a locality’s features, including skills, agglomeration, industry mix, knowledge anchors (e.g. universities), innovation density, housing elasticity, firm dynamism, and amenities, correlate with local economic growth and help explain why similar GDP gains correspond so differently into jobs and household income across places. But there is no simple recipe for growth because these factors interact, and the payoff to any one lever often depends on the local context. Underperforming places with abundant housing, for example, may still struggle to attract businesses if they lack enough skilled workers. Likewise, sector-focused training tends to raise earnings most reliably when it is tied to active employer demand; without it, newly credentialed workers may leave the region to find work rather than become local hires.
Although it is not possible to account for every interaction among these local factors, the discussion above points to an important general lesson: local conditions often matter in combination. Housing and amenities, for example, may affect whether a place can translate new labor demand into economic growth. In some regions, limited housing supply may restrict access to jobs, while in others, weak infrastructure or fewer local amenities may make it harder to attract or retain households and firms. Research suggests place-based policies are most effective when they are tied to concrete hiring needs in specific sectors and occupations, supported by enough housing for workers to access jobs, and implemented at a scale large enough for agglomeration spillovers to materialize. Demographic responses also matter. Regional policy analysis should consider how these factors work together.
In support of policymakers, the research and policy analysis community should devote greater and more systematic attention to regional economic dynamics. Several priorities stand out. First, distributional analysis of policy impacts should routinely include a geographic dimension alongside the standard income-based lens, improving understanding of who benefits, where they live, and whether national policies are reaching their intended places. Second, the models most commonly used in policy analysis should be extended or complemented with tools that can capture how policy effects vary across regions with different industry mixes, labor market conditions, and housing markets.
Third, analysts should invest in making existing subnational data more accessible and analytically useful — not necessarily by collecting more data, but by lowering the barriers to using what already exists. In practice, this means developing and maintaining standardized geographic crosswalks that allow analysts to link datasets across counties, census tracts, commuting zones, and metro areas without bespoke data engineering for each project. It also means developing composite indicators, such as measures of economic distress, labor market health, or regional resilience, that synthesize multiple dimensions of local economic performance into measures that are comparable across places and legible to a broad policy audience.
Some tools already point in this direction, including the Economic Innovation Group’s Distressed Communities Index and the EDA-supported StatsAmerica platform. The next step is to embed this kind of place-based diagnostic infrastructure more systematically into routine policy analysis. Regional analysis already produced by the Federal Reserve banks and academic economists could also be incorporated more directly into mainstream policy evaluation to explore the geographic incidence of public policies. Nationally calibrated tools can have sharply uneven regional effects, and understanding those effects should be a precondition for designing policies that work across the country.
This post is adapted from a previously published article, “Tracking Economic Underperformance in Counties Across the U.S. and Seventh District States.” The views expressed are those of the author and do not reflect those of the Federal Reserve Bank of Chicago or the Federal Reserve System.
 |
|
On the global level, the distorting bias is free capital flows, which means countries (like China, Germany, taiwan) have strong incentives to depress their currency to boost exports. Regionally, i think the lack of catch up of West Germany and the work Leah Boustan means that you can't stimulate a depressed region back into life. Better to realise the decline with an annual tax on land, and make internal migration easier and cheaper with generous welfare and lots of homebuilding in economically active areas