

No, Native-Born Employment Has Not Soared
A newly viral chart showing native-born employment levels is a multiple-count data felony. Focus instead on the native-born unemployment rate.

After recent monthly jobs reports, Administration officials and their supporters have been posting and talking about the astounding growth in employment for native-born Americans. The Vice President, the Secretary of Labor, and the new nominee for Bureau of Labor Statistics (BLS) commissioner have all recently trumpeted that there are two million more employed native-born Americans than a year ago.
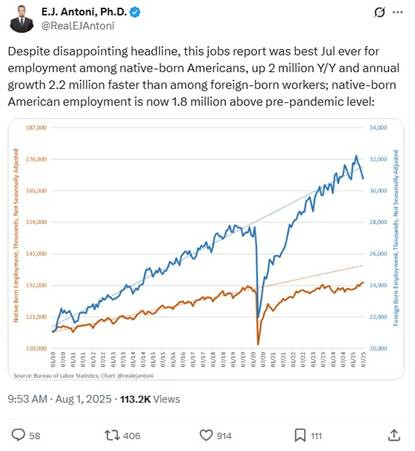
It’s not just Administration cheerleaders: respected mainstream economists on the center-left and center-right have charted and commented on these trends in native-born and foreign-born employment too. And no wonder: immigration is an urgent and contentious topic that directly affects the economy. (Note: these figures are readily accessible in the monthly jobs report, and the historical series of native-born employment and foreign-born employment are easily downloadable on FRED.)
But these charts and commentaries are a multiple-count data felony. The statistical agencies explicitly warn that these data are not suitable for sizing and trending the foreign-born and native-born populations. In fact, the apparent boom in native-born employment is just a statistical artifact, arising from arcane rules about how the data are constructed and population levels are determined.
The right way to see how native-born Americans are doing is to look at their unemployment rate. The native-born unemployment rate has increased over the past year, while foreign-born unemployment rate has not.
Before getting into the technical details, let’s pause to ask whether the supposed trends in foreign-born and native-born employment even pass the sniff test. The Current Population Survey (CPS) shows that from January to July the foreign-born population dropped by 2.2 million, and foreign-born employment by 1 million.[1] That’s bogglingly far outside a recent estimate by leading researchers that full-year 2025 net immigration (accounting for immigrants both coming and leaving) could range from +115 thousand to -525 thousand. Furthermore, the CPS reports that the native-born adult population rose by 3 million people from January to July, and native-born employment was up 2.5 million in those six months. How is that possible when population growth excluding immigration is typically a little over half a million annually? Was there a massive baby boom 16 years ago that no one knew about that’s now entering the workforce? Or a medical innovation that prevented any deaths this year? A moment’s thought says these swings are implausible.
Admittedly, the Center for Immigration Studies, which has reported on some of these trends, correctly notes that the “CPS is the only up-to-date public data source that allows for analysis of the total foreign-born population.” But although CPS may allow for analysis of the total foreign-born population, it’s not designed for it, and you shouldn’t do it. Here’s why.
Don’t Use the CPS for Levels or Shares of Foreign- vs. Native Born, Period
There are three reasons why the CPS should not be used to estimate the level or change in population or employment for the native-born or foreign-born. Very close readers of Census and BLS technical documentation know this already, but I’m going to spell it out in exhaustive detail.
First: the CPS has a small sample size. That means normal sampling error leads to large confidence intervals. For instance, the July 2025 estimate of foreign-born employment of 30.8 million has a confidence interval of plus-or-minus 720 thousand.[2] In other words, it’s 95% likely that the true level of foreign-born employment is within a range of over 1.4 million around that 30.8 million estimate. That’s huge! Total annual immigration to the US is typically less than that confidence interval. This large margin of error arising from the small sample size is one reason why the Census Bureau “routinely cautions against” using the CPS to estimate the foreign-born population.
The second reason is more technical – and more damning: the annual CPS population adjustment. Each year in January, the CPS updates the population totals for the survey to align with the latest Census population estimates. While the Census revises its population estimates back to the start of the decade in order to create a consistent series, the CPS population totals are not historically revised. Therefore, the total population as reported in the CPS jumps up or down each January, sometimes by a lot. In January 2025, the population adjustment was huge, adding 3.5 million people total, which upped the number of adults by 2.9 million, employed people by 2.0 million, and native-born employed people by 1.2 million.[3]
Again – this is key – historical CPS data are not revised. Table A-7 of the July jobs report shows a 2 million increase in native-born employment between July 2024 and July 2025, but 1.2 million of that increase – more than half! – is because of the population adjustment in January 2025. It’s not an apples-to-apples comparison. The BLS warns not to compare data from 2025 with data from earlier years – and that’s why.[4]
The third reason is the trickiest to understand but the most important. Census population estimates serve as the “population controls” for the CPS. That means that the total population reported each month in 2025 in the CPS equals the monthly population projections that Census calculated in late 2024. The population totals in the CPS are not affected by survey responses. For instance, we already know from published Census population estimates that the CPS will report that the US population in October 2025 will be 337,899,498.[5] These population controls predetermine not just the total population but also the population by age, sex, and race & ethnicity. That means we also already know that the CPS will report that there are, for instance, 5,308,938 Hispanic/Latino men age 25-34 in October 2025.
In contrast, the native-born and foreign-born populations are not predetermined by Census estimates; they are not part of the population controls. Instead, nativity (that is, whether someone was born in the US or elsewhere) is based on survey responses. But the native-born and foreign-born populations must add up to those predetermined totals for the population and for demographic groups, those “population controls”. If foreign-born responses drop for whatever reason – such as immigrants becoming less comfortable sharing data with the government – then the sampling and weighting procedures in the survey will adjust the native-born population as well so that the total population equals the population controls.
Imagine an extreme thought experiment: suppose the entire foreign-born US population vanished at the end of July: Tens of millions of people gone. What would that look like in the CPS? The reported foreign-born population would drop to zero. But because the total population is predetermined, the reported native-born population would swell to equal the total population, through sampling and weighting procedures. According to Census population estimates, the total US population as reported in the CPS will increase by around 180 thousand people between July and August. So if the entire foreign-born US population vanished, the CPS would show a reduction in the foreign-born population by tens of millions and an increase in the native-born population by that same tens of millions plus 180 thousand in order for the total population to equal the predetermined population controls.
Extreme? Obviously. But relevant. It’s plausible though unverifiable that the foreign-born population, as reported by the CPS, has fallen by some amount, because of some mix of less immigration, more deportations, and declining survey response rates among immigrants who could be concerned about how government data is being used for immigration enforcement. That would mechanically but artificially cause the reported native-born population in the CPS to rise just to make the totals line up with the predetermined population controls.
Here's some compelling evidence. Recall that the population controls predetermine not only the overall population but also the population for every demographic group by age, sex, and race/ethnicity. If the foreign-born population shrinks or their response rate declines, then the reported native-born population would automatically rise more in demographic categories with higher shares of immigrants. We should see a bigger increase in the reported native-born population among Hispanic/Latino men age 25-34 – a group with a high share of immigrants – than among, say, White women age 65-74, an overwhelmingly native-born group.
Let’s go to the numbers. CPS reported that the native-born adult population grew from 222,243 thousand in January 2025 to 225,276 thousand in July 2025, an increase of 3 million people or 1.4%. It turns out that this growth was disproportionately concentrated in demographic groups where a high share of people are non-citizen immigrants and therefore at higher risk of deportation or plausibly more hesitant to respond to surveys nowadays: Hispanics/Latinos age 25 to 64, and Asian-Americans age 25 to 44. (Older Asian immigrants are more likely to be naturalized citizens.) Analyzing CPS microdata downloaded from IPUMS, the native-born population in these high-immigrant demographic groups increased by an implausibly high 5.9% between January and July, while the native-born population in all other demographic groups increased 0.9% over the same period – a six-fold difference.
A deeper look confirms that sampling and weighting procedures are boosting native-born numbers in these high-immigrant demographic groups. The CPS surveys households using a 4-8-4 rotation: respond for four consecutive months, then an eight-month break, and then respond for another four consecutive months. In July 2025, the share of native-born CPS respondents in their first four months in the sample was 52.1% in high-immigrant demographic groups, versus 50.3% of native-born respondents in all other demographic groups – suggesting that sampling added native-born respondents to compensate for the recent drop in foreign-born respondents.[6] The average weight assigned to native-born respondents in high-immigrant demographic groups rose 7.5% between January and July 2025, versus an increase of 4.7% across all other demographic groups – suggesting that weighting helped increase the apparent native-born population to offset declines in the foreign-born.[7]
One hypothesis about the drop in foreign-born and rise in native-born population doesn’t hold up: respondents aren’t changing their self-reported nativity status from foreign to native across the months they respond to the survey. In 2025, just 0.1% of respondents who said in their final month in the survey they were native-born had responded in any previous month that they were foreign-born. This share of respondents who switched from saying they were foreign-born to saying they were native-born is tiny relative to the reported growth in the native-born population, and broadly in line with earlier years.
Thus: the reported increase in the native-born population – whether year over year or just since January – is the result of population adjustment and population controls used in the CPS. The decline in the foreign-born population is suspiciously large; the truth is probably a combination of a slowly growing or possibly slightly declining foreign-born population, combined with declining response rates for the foreign-born. But the huge jump in the native-born population is an artifact of survey sampling and weighting. It tells us nothing about the true population, employment, or labor-market experience of native-born Americans.
Here’s What We DO Know about Immigration and Nativity from the Jobs Report
Fortunately, the jobs report makes it easy to see how native-born and foreign-born people are doing in the labor market. Just look at the unemployment rate in that same table. For the foreign-born, it was 4.1% in July 2025, down from 4.7% in July 2024. For the native-born, it was 4.7% in July 2025, up a bit from 4.5% in July 2024.
The unemployment rate – like everything in the CPS – is based on a small sample, so it’s always good to average over several months to smooth out volatility, and to compare to the same months in a previous year to difference out any seasonal patterns. Comparing the average over six months of February to July 2025 with the average February to July 2024: the foreign-born unemployment rate was 4.1% in both 2024 and 2025, and the native-born unemployment rate rose from 4.0% in 2024 to 4.3% in 2025. Native-born workers are faring worse in the labor market this year than they did last year, prior to the summertime 2024 end of the immigration surge.
But what about those new 2 million employed native-born Americans in the past year? Look again at that table. That 2 million jump in native-born employment is a 1.5% increase. But the number of unemployed native-born Americans grew at a faster rate, by 6.1%. When quirks in the CPS population adjustment and population controls methods boost the population for a group like the native-born, they boost everything: not just the number of employed, but also the number unemployed and not in the labor force. The growth rate of the native-born unemployed was even higher than the growth rate of the native-born employed – which is mathematically equivalent to an increase in the native-born unemployment rate.
The unemployment rate is the best information the CPS offers about the native born and the foreign born. Ignore the levels of population and employment: they mislead.
The other half of the jobs report – the payroll survey – shows how immigration trends affect the labor market from a different angle. Employers are not asked about the citizenship or nativity of their employees, but industries differ significantly in how much of their workforce is immigrants. Adapting an algorithm by economist George Borjas, I estimated the unauthorized-immigrant share of industries based on American Community Survey data and compared monthly job growth in the payroll survey in high unauthorized-immigrant industries with the rest of the private sector.
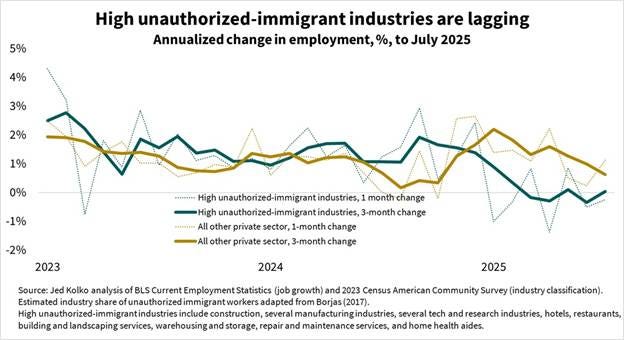
Job growth in high unauthorized-immigrant industries started lagging other industries after the immigration surge ended in mid-2024 and has been flat since the start of 2025. Job growth in other industries has also slowed but less so. The end of the immigration surge coincided with a slowdown in the immigrant workforce and in the growth rate of industries that rely more on immigrants. These payroll survey data are not subject to the population-control issues of the household survey, and they are properly revised each year in the annual benchmark revision process such that the series remains historically comparable.
If Charting Native-Born Employment Levels Is a Crime, Are the Statistical Agencies Accomplices?
No. Census warns against using the CPS for estimating the size of the foreign-born and native-born populations, and BLS discourages users from comparing data across years. Ignore their warnings at your peril.
Perhaps, out of an abundance of caution, they could put only the unemployment rates and other ratios like labor force participation and the employment-population ratio in the published table, and leave out the levels of population, employment, and other measures. However, transparency calls for publishing the numerators and denominators next to published ratios and rates, even if the numerator or denominator used separately is misleading. And anyway it’s straightforward to replicate the published table using underlying series files or the public-use microdata. Including the levels for native-born and foreign-born is helpful for people without the skills or tools to dig into the weeds.
One clear improvement would be creating historically comparable microdata weights that would allow comparisons of CPS series across years. I have done this, as have Fed researchers, but nothing beats an officially sanctioned version. Another improvement could be to include nativity as a population control, alongside age, sex, and race & ethnicity – though that requires high-quality immigration projections, which are challenging even when immigration trends aren’t rapidly swinging from one extreme to the other. Until then: ignore the levels, and focus on the rates. The clearest measure of how native-born workers are doing is their unemployment rate.
All CPS microdata used for this analysis were downloaded from IPUMS-CPS, an invaluable resource for researchers. Sarah Flood, Miriam King, Renae Rodgers, Steven Ruggles, J. Robert Warren, Daniel Backman, Annie Chen, Grace Cooper, Stephanie Richards, Megan Schouweiler, and Michael Westberry. IPUMS CPS: Version 12.0 [dataset]. Minneapolis, MN: IPUMS, 2024. https://doi.org/10.18128/D030.V12.0
[1] The CPS is also called the household survey of the jobs report and is a joint product of the Census Bureau and the Bureau of Labor Statistics.
[2] Based on my calculations using BLS instructions and parameters.
[3] The population adjustment to native-born employment is in an unpublished BLS table available on request.
[4] To compare CPS data across years, use my historically comparable microdata weights, which incorporate the latest Census population estimates and historical revisions.
[5] That is, the sum of the weights assigned to all respondents in the October 2025 CPS will equal 337,899,498, which is the Census projected estimate for the civilian noninstitutionalized population for that month.
[6] This is the share of respondents in the first four months of the eight months respondents typically participate in the CPS. Typically the share of respondents in the first four months of the eight-month rotation is very close to 50%.
[7] This is the COMPWT variable in IPUMS-CPS.